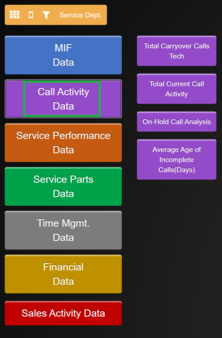
D2 Call Activity Data Dashboard
2.0 Call Activity Data
- Total Carryover Calls Tech
- Total Current Call Activity
- On-Hold Call Analysis
- Average Age of Incomplete Calls (Days)
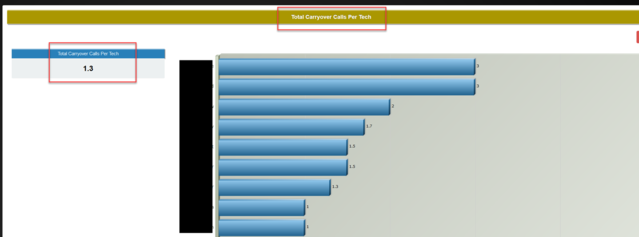
2.1 Total Carryover Calls Tech
This graph gives real-time information, by technician, on the number of carryover calls.
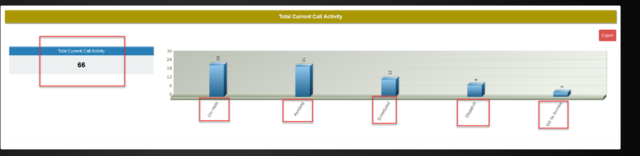
2.2 Total Current Call Activity
This bar chart allows you to see the Total Current Call Activity plus: On-Hold Calls, Pending, Scheduled, Dispatch, Invoicing of Calls
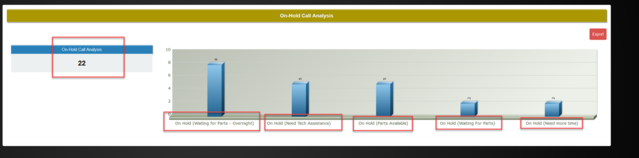
2.3 On-Hold Call Analysis
This bar chart allows you to see the status of On-Hold Call Activity:
- On Hold (Waiting for Parts)
- On Hold (Need Tech Assistance)
- On Hold (Parts Available)
- On Hold (Waiting for Parts)
- On Hold (Need more time)
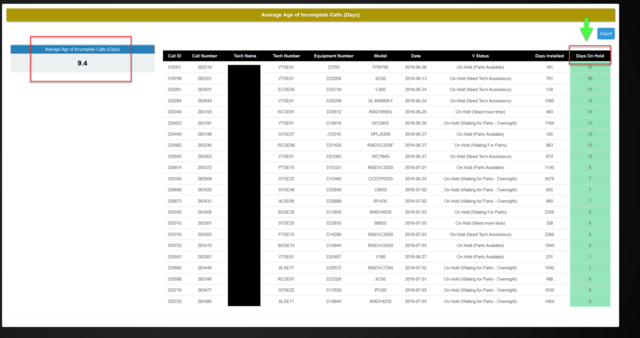
2.4 Average Age of Incomplete Calls
This graph gives real-time information, by technician, on the average age of incomplete calls (GREEN) and an overall company average (BLUE).
PIVOT gives a detailed overview by Model, Days Installed, Call Status, etc.